The following steps set up your charts :
- Open a new EUR/USD 1 minute candlestick chart.
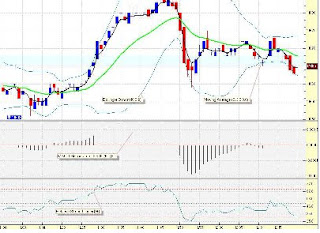
- Add Bollinger Bands set at 18, Exponential. Change the color of the middle band to bright green.
- Add a moving average 3 Exponential, Close and change the color to black.
- Add the MACD Histogram Study
- Add the Relative Strength Index
- Zoom in or out to your liking.
0 comments:
Post a Comment